An Ishikawa diagram is a graphical method for root cause analysis. First documented by Kaoru Ishikawa in the 1960s, it is used to this day as a cornerstone of continuous service improvement. Because of its shape, it is also known as the fishbone diagram. Another name for this technique is cause-and-effect diagramming.
Ishikawa diagrams are deceptively simple looking, but don't let that stop you. Using this technique you can see all possible causes of a result (a Problem for example), and uncover the root cause of faults.
Ishikawa diagramming requires no investment in software or tools. It is a group exercise. Following I describe how, why and when to create and use Ishikawa cause-and-effect diagrams.
Root Cause Analysis
Ishikawa, "Fishbone," or cause-and-effect diagram all refer to the same thing: a graphical representation of inputs (causes and reasons) and an output (the problem or event). A practitioner guides a group in organizing causes according to importance. This results in a graphic showing the relationship between causes, reasons and the problem under study. This graphic helps identify root causes, inefficiencies, and others issues.
The ITIL assigns Problem Management the responsibility for determining the root-cause of an event or fault. The role of a Problem Manager is to coordinate and guide troubleshooting activities usually for difficult or cross-domain problems.
Ishikawa diagrams fall right into place with other similar tools including Kepner-Tregoe and others.
Ishikawa diagrams are similar to other quality tools. Using paper, blackboards or flipcharts, the practitioner attempts to visualize, gather and organize information. As simple as it sounds, often just getting all the ideas of a group of people organized into a diagram dramatically speeds problem diagnosis and resolutions.
Use this technique whenever you must:
- Determine the root-cause of a problem
- Understand the possible reasons why a process is not delivering as expected
- Identify areas from which to collect data
Completed Ishikawa diagrams somewhat resemble a fishbone, and thus the nickname of "Fishbone Diagram." Keeping with the fish analogy, the "head" should contain a problem description. From the head originates the "spine" of the diagram. From the spine, "ribs" indicate the major area that can cause the problem as described.
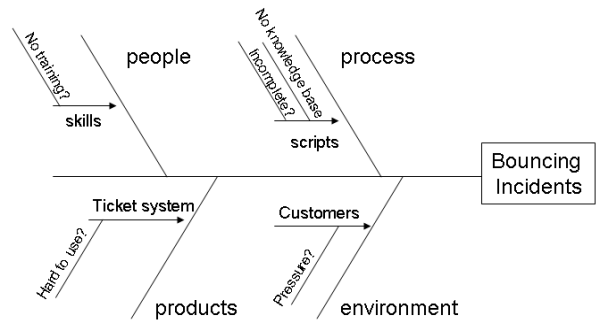 Figure 1. Example Ishikawa Diagram
Ishikawa diagramming is most useful as a group tool. The practitioner uses this technique to bring together the combined resources of several people. Prompted by the practitioner, the group contributes to the diagram. When complete, the diagram contains all the possible elements and data related to the problem. Analysis of the completed diagram determines the course of action to take.
In ITIL, "3 P's" normally represent the starting point for the "ribs." The 3 Ps are: People, Process and Products (tools). Note that you can use any ribs you desire, in the diagram above I have added "environment." Feel free to modify your ribs to suite the issue at hand. The goal is to identify just a couple of main rib categories that include the most probable contributing factors.
There is no limit to the complexity of the diagramming. The example is simple, but yours may become very complex. Normally, more than 4 or 5 levels are too complex to yield any visible root cause.
When the diagram is complete, the team has a graphically organized document showing all the possible causes of the problem described. Next, the group discusses the most likely root-cause and comes up with a plan of action.
Creating an Ishikawa "Fishbone" Diagram
The creation of an Ishikawa diagram follows a simple process:
- Assemble a group of people familiar with the problem at hand.
- Draw a flat horizontal line as the "backbone" and a box to the right of the backbone as the "head" on a presentation board or flipchart.
- Work with the group to arrive at a problem description that is clear and concise. Write the problem description in the problem box or fish head of the diagram. In the example, the problem is "bouncing incidents," referring to why some incidents "bounce" between support groups.
- Have the team discuss and agree to the major cause groups or initial "ribs." If the group cannot agree on the major causes, just use the 3 P's -- People, Process, Product. Write a label for each "rib" allowing space for reasons as shown in the example.
- Use traditional brainstorming techniques to fill in possible reasons for the "ribs" as follows:
- Ask each person one by one to give a possible cause (perhaps in the form of a question) for each "rib." Each person should submit one possible reason, and if they cannot think of one they can pass. Make sure that each cause is clear, concise and measurable.
- Draw the cause on a line connected to the appropriate "rib" and label it with the cause. If the proposed cause is a factor in an existing cause (rib), then draw another backbone off the rib, add another rib, and label it.
- Go back and repeat until everyone says, "pass" and there are no more possible causes for existing ribs and there are no new ribs to add.
- With the fishbone complete, now review and discuss the Ishikawa diagram to look for common or repeated causes. Try to determine the root cause of the problem.
The fastest and easiest way to interpret Ishikawa diagram results is to select and rank the top 5 causes. Let the group decide how to rank the causes. The 5 Whys are also useful in determining the most likely root-cause when the diagram is completed as well. (See the "Five Whys to Solve Problems" DITY link below for more on this technique). Circle the selected causes. Have appropriate group members investigate these causes using other troubleshooting techniques. Repeat as required.
Mastering Cause-and-Effect
Experienced practitioners limit the number of "ribs" (causes) to focus the group. Some suggest allowing no more than 3 to 5 ribs. Other key Ishikawa usage techniques include:
- Using sticky notepad sheets for the ribs or inputs to make rearranging the fish bones easy;
- Framing the problem as a question, such as "why are incidents bouncing back and forth between support groups?" Each cause should answer that question.
- Ensuring that "ribs" are causes of the problem, not symptoms of the problem;
- Using brainstorming to determine exactly what the ribs should be the "5 Whys" technique can help here;
- Checking that the causes on the diagram are not themselves other problems;
- Combing empty (or nearly empty) ribs with or onto other related ribs as appropriate;
- Splitting up dense ribs into additional ribs as appropriate;
- Making copies of the results and circulate them to others to gain more insight and involvement of staff.
The Ishikawa diagram is a powerful tool for harnessing the combined knowledge and experience of a group of people. It lets the group focus on why problems occur without the distraction of symptoms.
Try fishing for a solution the next time a tough problem comes up. And don't limit yourself the Problem Management use this technique anywhere you need to determine the root cause of something.