ITIL labels this function an Operations Bridge (OB):
"A physical location where IT Services and IT Infrastructure are monitored and managed."
The roles and tasks of an OB, part of ITIL V3's Operations function, are technical and system/service specific. With the level of proactive monitoring technology available for systems, applications and services, the OB Event Management System (EMS) often has to be able to handle many times the number of Events per user base than the Service Desk does Incidents.
The diversity of an Operations Bridge requires many different skills levels and specializations than the NOC of times past. The interlocking dependencies of diverse infrastructure assets call for a level of technology convergence support that has never existed before. This results in Operations Bridge staffing models that are far more complex than the simple NOC of years past.
It is tempting for OBs to use a "rule-of-thumb" staffing model that includes specific skill levels for specific systems and services, such as IT research and advisory companies publish. At best, "rule-of-thumb" will provide a rough model of the number of people required to support a specific number of systems. What is needed is a set of more comprehensive staffing models.
I spent several years working for a Type III Operations Bridge organization where I developed a services catalog that included all of the technology and staffing budgets for the various services provided by the OB. The technology cost models were very straightforward with fixed and easily understood capital and operations costs for each service provided.
Because of the diversity and convergence of the services, however, the staffing costs for each service were not as easily represented. This was compounded by the size differences of the customer companies and the varying support services for which each company contracted. In some instances, the OB provided the total Operations Management support for a company; in others, the OB provided support for only a single technical service, such as backups.
Breaking Things Down
The amount of time a staff member contributes to the support of a service is known as Level of Effort (LOE), which refers to the amount of time it takes to perform tasks with specific roles of support. In the United States, with vacation time, sick days, etc., the base LOE of a person is normally about 1880 hours per year.
An outstanding shortcoming of the "rule-of-thumb" models is their lack of capability to blend skills levels for different roles and tasks. For example, a level-one skilled person would not be doing or contributing LOE to a level-three role or task within a specific service support. However, the level-one skilled person does require a certain amount of LOE contribution from level-two and level-three skilled persons in support of a service task. This means that each service, system, and infrastructure asset supported by an Operations Bridge has a support model that consists of a blend of levels of skills.
Skills Level of Effort
The labor cost models that account for the blending of skills and differentials is referred to as Skills Level of Effort (SLOE) models. SLOE models take into account the contribution LOE of each of the skills levels and organizational roles that go into providing the support of specific assets and services. The models can be broken down to the SLOE for specific roles and tasks of support, such as:
- L3 - primarily only level- three skills support
- L3-L2 - a blending of level-two skills support with some level-three skills contribution
- L2 - a blending of primarily level-two skills support with a small amount of level-three skills support
- L2-L1 - a blending of level-one skills support with some level-two skills, and a small amount of level-three skills contribution
- L1 - a blending of primarily level-one skills contribution with a small amount of level-two skills, and an even smaller amount of level-three skills contribution
There are some very low- roles and tasks, such as data entry by a low-level staff admin. Because low-level admin staff are often tasked with maintaining general information within an OB, they also should be considered to be providing a small contribution to the overall LOE of all of the support roles in an OB. On the opposite end of the spectrum, managers, while not directly contributing to the LOE of a support role or task, do provide the oversight of the individual contributors and as such should also be included in the blended skill levels.
Added to the costs of blending of levels of skills in the support of IT infrastructure and services is the distinction of normal business hours (NBH) versus full twenty-four hour, seven days a week (24x7) support roles and tasks. Higher-level skilled roles generally tend to be NBH, with some nights and weekends.
Support roles, such as monitoring applications, networks, and systems are generally 24x7. 24x7 staff tend to be level-one skilled personnel, with shift differentials for working "after hours." In addition to the blending of skills levels, some support models have to take into consideration the blending of normal business hours and after-hours staffing LOE.
Fortunately, this blending of skills and labor costs is easier to model than it appears. For mature organizations that currently provide proper support for the IT infrastructure and services, their current staffing levels at various skills level provide a basis for developing the blended SLOE models for each of the support roles and tasks that they provide.
For organizations on the road to maturity, their current staffing can be used to develop their current SLOE models, which can help document the specific changes and costs that are needed to make improvements.
SLOE models can help document the reduction of labor costs that can be achieved by adding technology and automation to an Event Management system. In mature organizations with good levels of automation in their EMS, SLOE models can determine when and at what level they need to add staff to support new customers, infrastructure, or services.
In the Operations Bridge organization that I was working for, I used a multi-page spreadsheet to develop the SLOE models. Because the organization was fairly mature, I started with the existing organization staffing levels and skills levels and developed SLOE models of the existing services delivery.
Initially I used my personal experience in different support roles for various types of infrastructure assets to assign specific SLOE requirements to the different tasks in each role. After I had the model at an advanced stage, I took it to OB staff members working in different roles and at different skills levels to help verify the specific SLOE for each task in each role.
After I had made adjustments to the specific task SLOE requirements, I took the spreadsheet to the OB management for its considerations and input. We found that SLOE models gave the same or better overall support requirement numbers than the "rule-of-thumb" models that were published by a major IT research and analyst firm, but at much greater detail and verifiability.
SLOE Models Spreadsheet
Step 1. Develop Basic Spreadsheet. This starts with a set of comments and assumptions that establishes the basis for going forward with the initial SLOE models, such as "EMS provides adequate automation, alert integration, filtering, and de-duplication and outage correlation to Incidents. Monitoring staff 24x7 coverage requires shift differential for specific members of the staff. Etc." I insert a high-level definition table of the skills levels at the top of the spreadsheet.
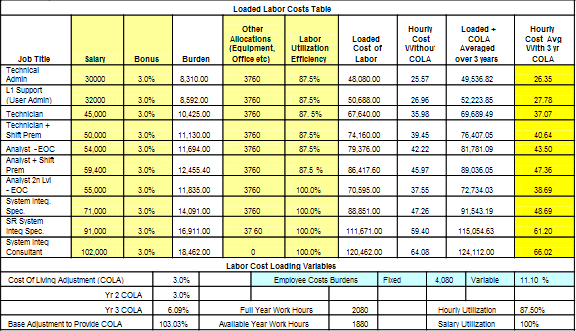
Step 2. Add Staff Resource Pricing. This step inserts staff resource pricing based on the different job titles, salary base for each title, bonus, burden, and other cost allocations such as office and facilities costs, and labor utilization percentage. This gives a loaded labor cost for each job title.
We used a labor utilization of 87.5% for hourly personnel titles, which some considered high compared to other organizations (labor utilization for Service Desk associates is normally considered to be 60%). Salaried personnel titles were given a utilization level of 100% because it was recognized that they often worked some overtime without additional compensation.
 Table 1 Loaded Labor Costs by Skill Level
We added a cost of living allowance (COLA) over three- and five-year spans to the loaded labor costs because that was the standard length of contracts offered by the OB organization. The addition of COLA to the loaded labor costs allowed us to provide additional accuracy and detail prediction of the cost of services delivery for each new potential contract.
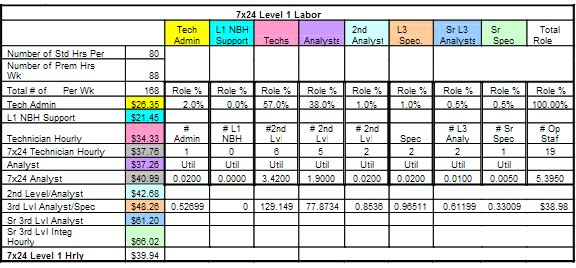
Step 3. Build Operations Bridge Organization Table. Based on the assumption that the OB was at that time fairly mature, specific numbers of the different job titles were inserted as a starting point for the specific support level tables, one for each different support level. Each table identified the percentage each job title had in a customer support role for the support level. The numbers from the staffing table were then inserted to give an overall utilization within the support level role. The role utilization was applied to the loaded labor costs for each job title and added together to give the loaded labor costs for each level of support.
Step 4. Identify Support Roles & Tasks. Using additional pages in the spreadsheet, we identified each support role and specific task and assigned a level of support. For example, monitoring the Event Management system's actionable event queue and taking the required action would be a L1 role; managing and configuring backup processes and systems would be a L1-L2 role; administration of Microsoft OS would be a L2 role; administration of VM Hypervisors would be a L2-L3 role; implementing and initial configuration of systems would be a L3 role.
 Table 2 Example of Skills Level of Effort Loaded Labor Costs for Level 1
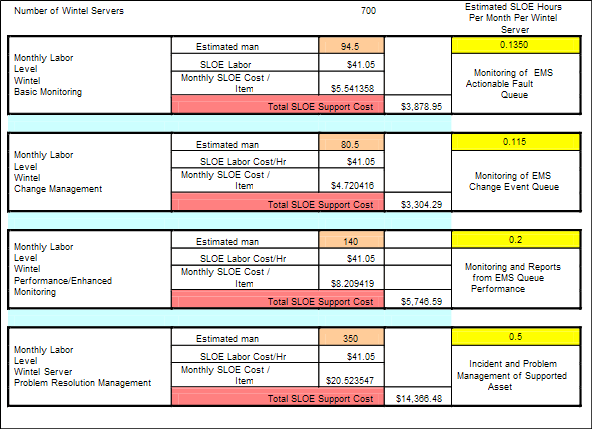
Step 5. Identify Task Time. After the level of support, we assigned an amount of time for each task/role. The amount of time for each task/role needs to be an approximate average over a period of several months.
 Table 3 Example of SLOE Support Service Cost Models
Step 6. Compare to Actual Environment. Utilization efficiency for the level-one staff was initially set to 60%. When we compared the spreadsheet to the actual working environment, we found that due to the integration and automation of the EMS, the L1 support technicians were actually handing a greater number of Events per person. The utilization was modified and reset to 87.5%, reflecting the unreliability of backup systems and media that required a sizeable number of complex restarts.
SLOE Model Advantages
From the SLOE models, the amount of time for each task/role for each blended support level can be compiled to derive approximate staffing requirements at each technical level. The approximate staffing requirements can be compared to the available working time for staff at each of the technical levels. This will show up any inconsistencies between the support staffing requirements and the available staff at specific technical levels.
It may show that there are too many L2 staff for the tasks/roles that are being supported, and not enough L1 staff, indicating the need to hire more L1 staff. On further examination, if you find that the L2 and L3 staff are filling in for the L1 staff, by hiring more L1 staff, you can free up the L2 and L3 staff to other roles.
It could also show that there was more level of effort for L2 tasks/roles than is available from the existing L2 staff. This could indicate that the L2 staff are working excessively high levels of overtime to achieve the required support. It could also indicate that the L1 and L3 staff are having to fill in, with the higher potential for mistakes and Incidents due to improper service support.
Practical Use of SLOE Models
The loaded labor costs for each task/role can be calculated based on the level of support and the allocated time for that task/role. Additional pages can be added to provide for labor cost increases due to COLA for each year over a five-year period. Also specific allocation can be made for cost reductions due to improvements in the customer's specific systems and services, monitoring technology, and EMS automation. The SLOE labor costs can help develop budgets for the existing services and provide labor cost models for any planned or future IT services deployments.
In the case of the OB organization that I was working with, the final spreadsheet provided detailed SLOE models for each of the support tasks within each of the support roles for each type of the infrastructure assets and services supported by the OB. The SLOE models provided a pricing tool for the sales organization to use in responding to new sales opportunities. This resulted in a very predictable cost of service delivery, which in turn provided very reliable revenue margins predictability.
After final refinements, the SLOE models were used to provide labor costs for each new service that the OB provided to each new customer. The SLOE models were accurate enough to predict the margin for services within a very few points over a two-year period.
SUMMARY
As new technologies, infrastructure asset types and services were added to the OB support services catalog, the support roles and tasks were identified, quantified and added to the initial SLOE models. For example, when support for VOIP systems and services were added, initial task SLOE numbers were assigned and then revisited and modified after six months of support experience, and were then used to provide ongoing costs to customers for providing that support service.