Process theory and practice drive the ITIL Lifecycle phases and activities within them. The Service Design phase of the ITIL’s IT Service Management Lifecycle is no exception. Service Design and its activities adopt a process-oriented approach to the design of new or changed IT Services. What is different, however, is that the Service Design phase also assumes the responsibility for assisting ITIL process owners in designing processes to ensure that all processes use standard terms and templates, are consistent, and provides end-to-end integration across all areas. In other words, it is “processes designing processes.”
One objective of the Service Design phase is to design process templates that focus on built-in improvement mechanisms. In general, ITIL considers it preferable to design practical processes that can be easily adopted throughout the organization, even if the processes are less than ‘perfect.’ Built-in improvement mechanisms will allow improvement in the future. A similar approach should be taken when designing IT Service measurement systems.
Almost everyone in IT knows the old saw, “If you can’t measure it you can’t control it.” Yet the majority of new or changed systems deployed today either operate under no, or an inadequate, measurement system. An IT Service measurement system should consider all aspects of what it takes to measure an IT Service’s utility (fit for purpose) and warranty (fit for use). This means that the scope of the measurement system extends beyond just the technical measurements of component or system availability and performance.

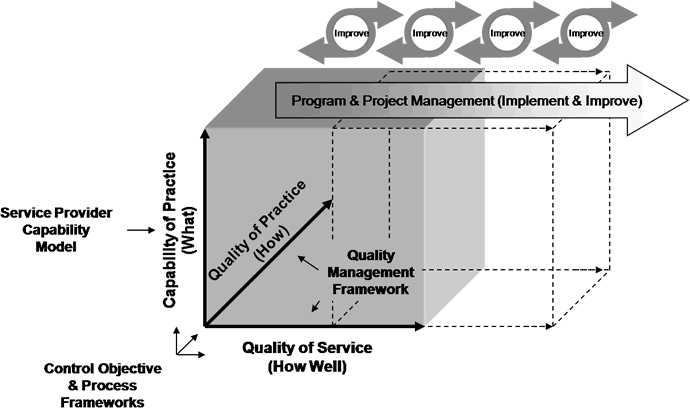
The diagram above illustrates this. Here we look at this concept as a function of the capability of the service provider, its service management process capability and the performance of the supported IT Services.
The Service Provider
The Service Provider is measured in the context of its “organizational capabilities” to utilize its “resources” to provide the IT Service required by its customer. This is applicable for both internal and external service providers. Their organizational capabilities span management, organizational structure, deployed processes, organizational knowledge and people. These capabilities are needed to act efficiently and effectively on the organization’s available resources (capital, infrastructure, application, information and people) to deliver IT Services that are fit for purpose and fit for use.
The “dot bomb” era was littered with the bleached bones of service providers that had plenty of resources (money and technology) and very little organizational capability.
The Service Management Processes
The whole idea behind ITIL is that IT Services should be delivered in the natural context of an IT Service’s lifecycle, and that the phases of that lifecycle are supported by processes and their activities. The quality of an organization’s process capability (Quality of Practice) is measured by the four metrics.
Progress metrics measure the progress toward the completion of something. Examples are milestones and deliverables as defined in a formal project plan. Note that if there is no project plan, it becomes exceedingly difficult to define a milestone or to declare a deliverable as evidencing progress.
Compliance metrics measure compliance to a regulatory standard or goal. It is generally an all or nothing measurement. Although you may comply with 6 out of 10 (60%) of some regulatory standards or points, you cannot comply 60% to any one standard or point.
Effectiveness metrics measure accuracy and completeness. An example is ‘responding to 90% of Service Desk calls within 20 minutes’ or ‘reducing repeat calls about the same Incident from 15% to 5%.’
Efficiency metrics measure the utilization of resources. An example would be to measure the efficiency gained from establishing an automated Request Fulfillment system versus a previous manual one.
All metrics start by establishing goals, defined by Key Goal Indicators that indicate which attributes contribute to the success of reaching the goal. A method to define goals and their supporting metrics is the Goal Question Metric (GQM) approach.
GQM
The Goal-Question-Metric (GQM) approach arose from work done in software engineering. GQM offers a solution for clarifying any statement, especially statements expressing or related to attaining a goal. GQM is very useful for defining and clarifying transparent Goals, Critical Success Factors (CSFs), as well as Key Performance Indicator (KPI) metrics.
GQM can help derive metrics from questions about goals. Fundamentally, KPIs measure progress toward goals as reflected in CSFs. KPIs are then quantifiable measurements, or metrics. GQM has some powerful benefits when applied to IT Service Management:
- Simple, form-driven application
- Easy to use in groups
- Works with all processes
- Produces metrics customized to the Continuous Service Improvement(CSI)
- Delivers powerful insight into organizational and process structure
- Reflects the viewpoints of the staff (IT, customer, stakeholder) involved
The Service
The Quality of Service is an aggregation of the quality of each component that participates in a given IT Service. The difficulty is understanding and documenting the complex component relationships within the infrastructure, and understanding and monitoring the components in such a way as to gather and manage the minimal amount of meaningful data. These data are usually grouped into five broad areas; availability, performance, capacity, failures and changes.
The Metrics Tree
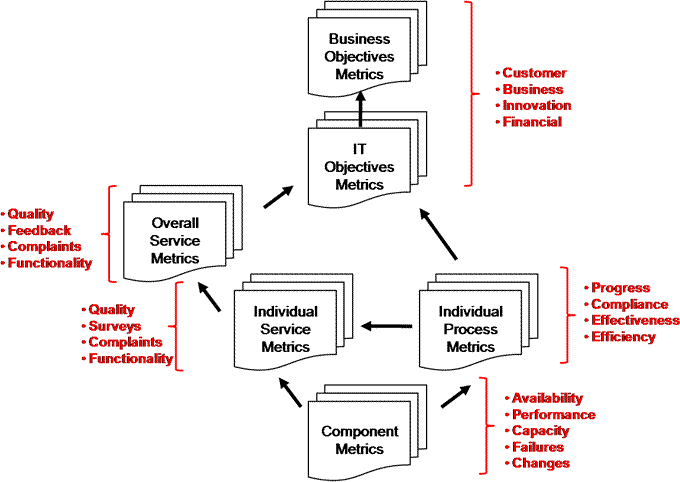
Detail metrics do an outstanding job of chronicling the success or problem areas of individual processes or tools. However, organizations realize the full benefit of metrics only when they aggregate them to provide a picture of how well the organization is doing as a whole.
Consider a Service Desk that is posting excellent first-call response metrics for hung router ports. However, the concurrent service metrics are showing customer dissatisfaction with quality levels because of the frequency of the interruptions caused by the malfunctioning routers. In this case, a combination of process and component metrics would have given a complete picture of the service metrics.

The “metrics tree” depicted here progressively aggregates metrics. Based on a “tree data structure” It considers how individual component metrics contribute to both individual process and individual service metrics, and further folds individual process metrics into the metrics for the individual services and ultimately overall services.
The top two levels borrow from the four quadrants of the Balanced Scorecard, developed by Drs. Robert S. Kaplan and David P. Norton, to demonstrate how well the IT and business strategies are being achieved in each area.
Summary
A major difference between a marginally-effective and a highly-effective IT organization is that the latter knows their Capability of Practice, Quality of Practice (Process) and Quality of Service. The “metric tree” is just one of the techniques well managed and highly-effective IT organizations use to measure their capabilities and maturity as service providers.